The bull market will continue, but prices are moving up faster than we’d like
As we indicated last week, there is no sign of a recession in the US economy, which is good news for the stock market. This week we take a quick tour of what we see in the stock market and make an educated guess at what we might expect in the next six to twelve months.
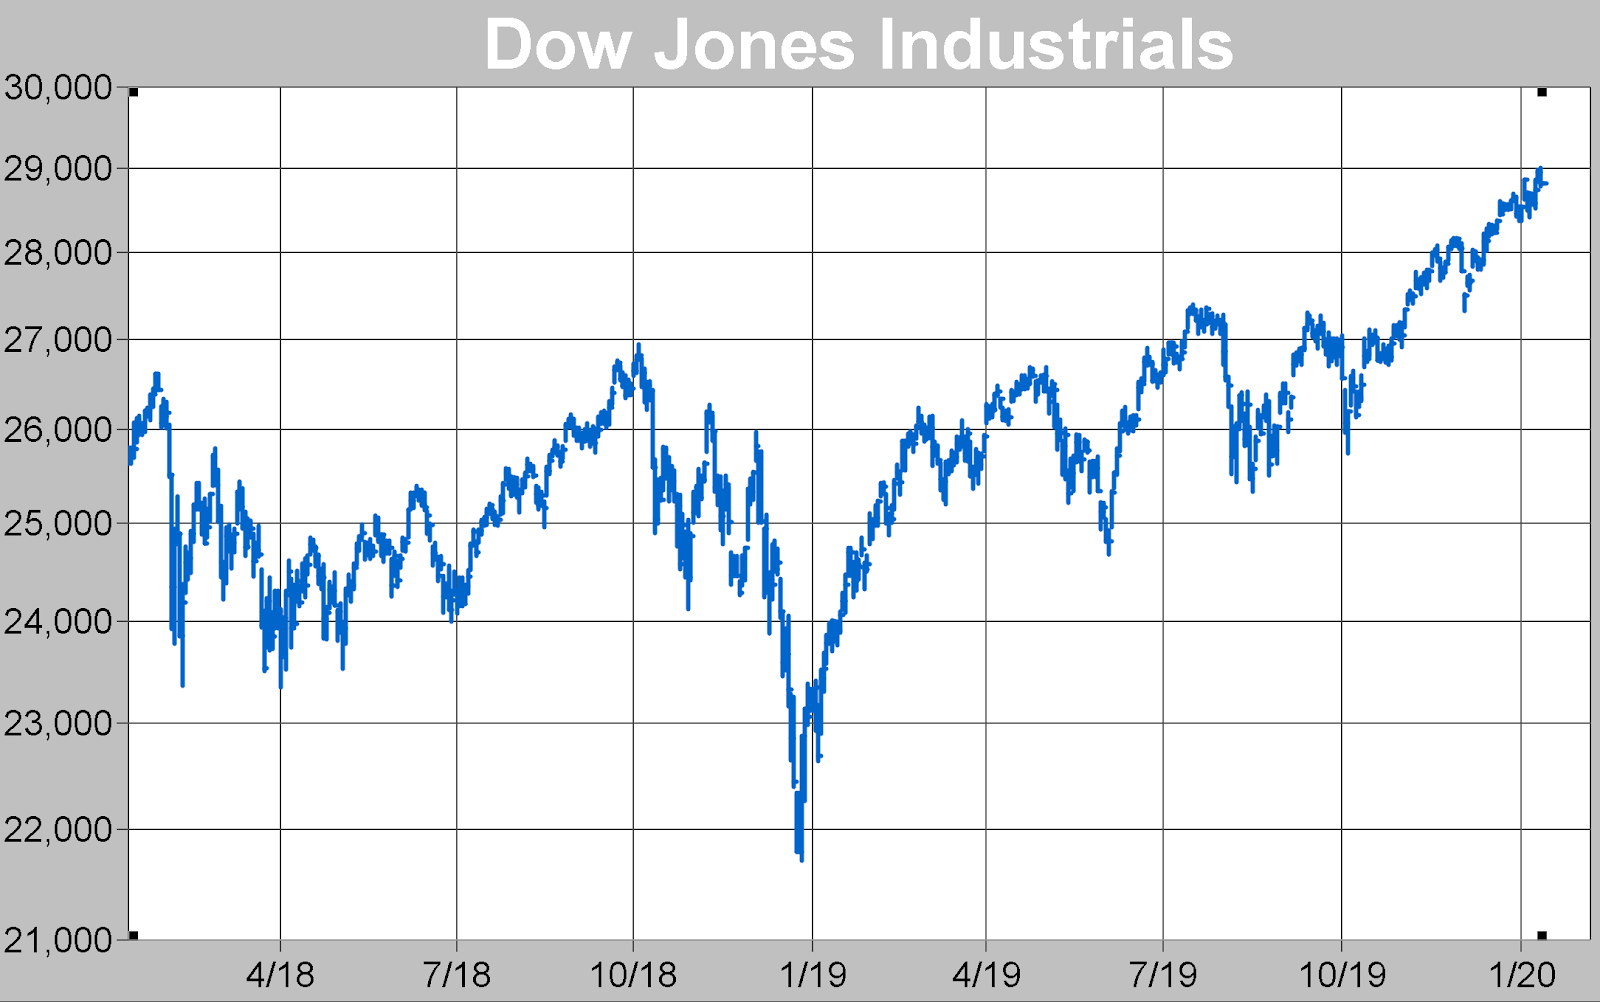
Below is a 2 year chart of the Dow Jones Industrial Average. Until last November this index was struggling to get through the 27,000 level. It’s now just south of 29,000. The S&P 500 and NASDAQ look similar, but much stronger. During that 15 month struggle, the bears were looking for a market top—they turned out to be wrong, once again.
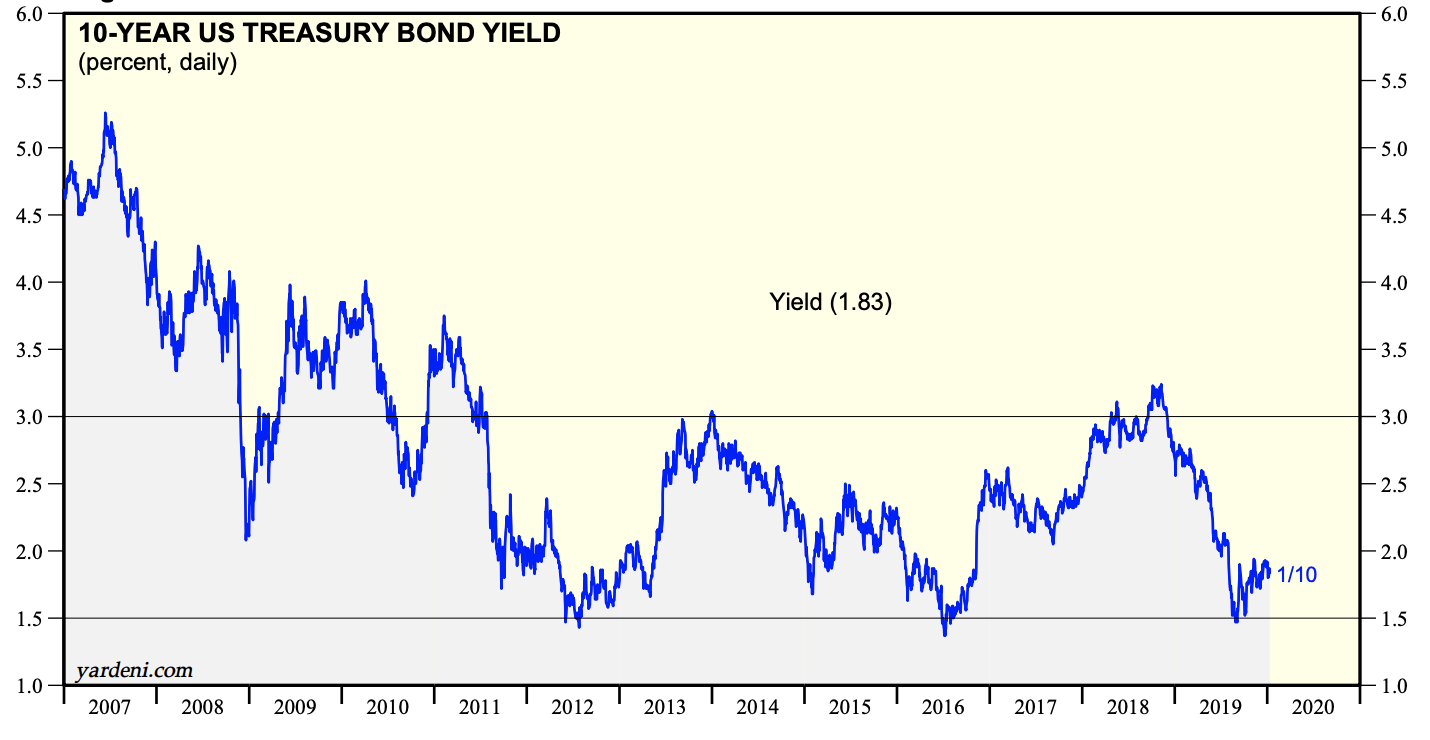
But why is the market making new highs nearly everyday? Normally we would focus on earnings growth as the driver, but there’s another factor that influences stock prices: interest rates. Below is a chart of the 10 Year Treasury bond. The current yield is 1.85%. As recently as October of 2018 the 10 year bond was yielding 3.25%. These numbers don’t look that different from each other, but they make a huge difference to the value of stocks.
How does this work? See below.
Sometimes an extreme example can help:
Imagine that Treasury bonds were yielding 10%. There is practically no risk that the US government will fail to pay. Dividends paid by stocks today are less than 2%. In that 10% environment it would be foolish to pass up bonds and invest in stocks.
Now imagine that Treasury bonds are yielding zero (0%). Not impossible in a world with $14 trillion in negative interest rate bonds outstanding. Suddenly a 2% yield in the stock market looks a lot more attractive.
With low inflation investors have concluded that low interest rates are here for the foreseeable future. That opinion is expressed in the chart below showing the PE ratio of stocks back to 1982.
.
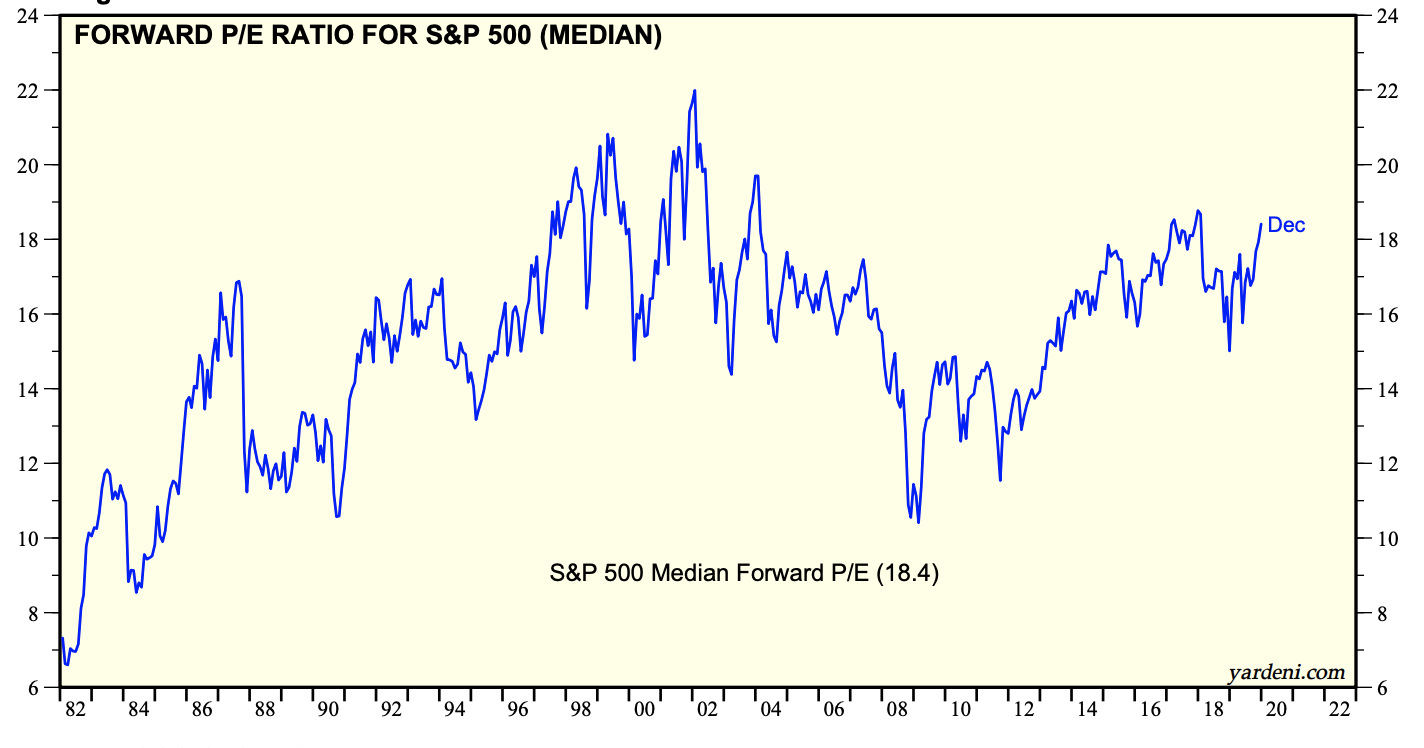
The market could be wrong about the sustainability of low interest rates, but inflation needs to rise a good deal before interest rates will threaten the stock market.
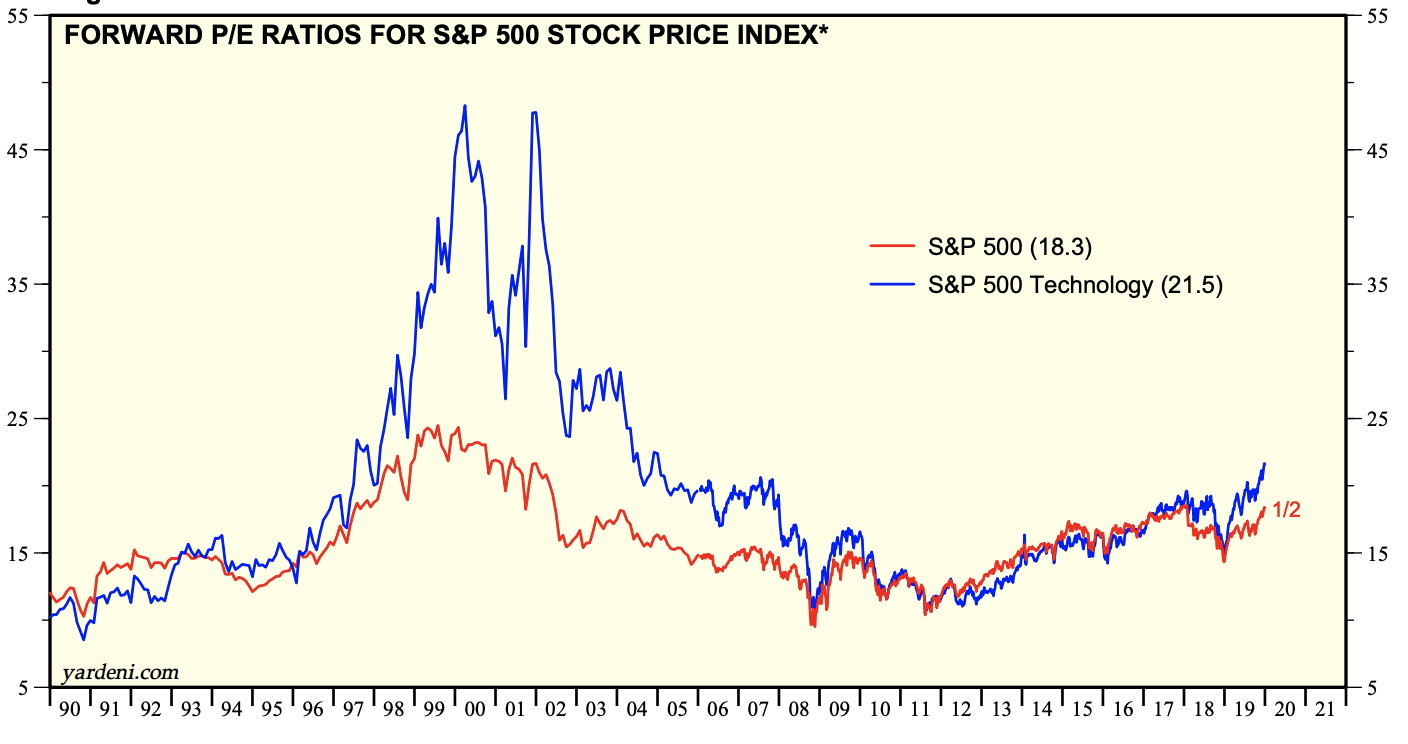
But is there a new technology bubble? Tech stocks are trading at higher prices than the average stock, but this nothing like the DotCom bubble of 2000. The 30 year chart below compares the PE ratio of tech stocks in blue with the S&P 500. The fact is, technology stocks are growing at higher rates than most stocks in the S&P—they should be priced higher.
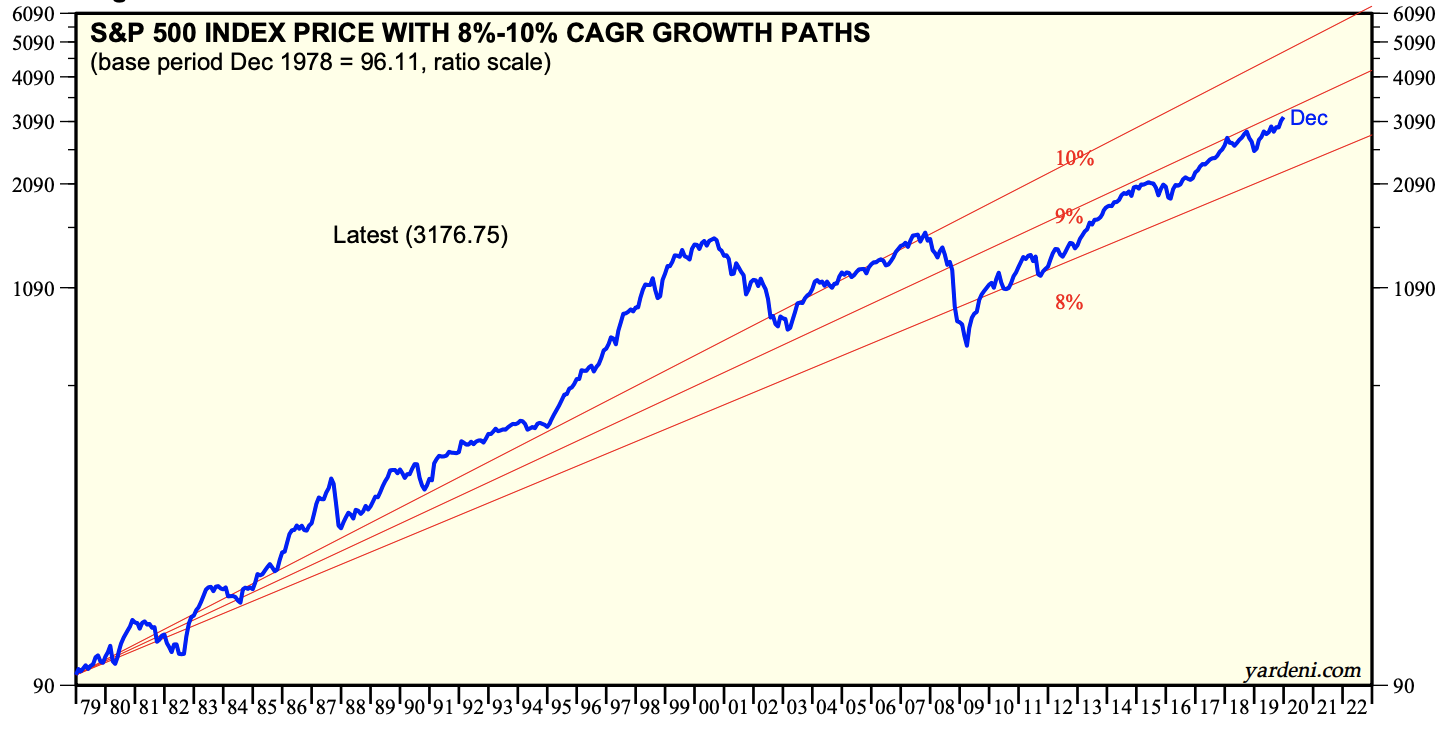
But are stocks going up too fast at the moment? Yes. At the current rate of gain the market would be up 42% in 2020, a highly unlikely outcome following a super-strong 2019. But is it way out of line historically? The next chart says “no”. The current ten year bull market has only brought the market back into the normal range of 8% to 10% growth. We have simply recovered from the two massive bear markets that began the 21st century.
Our conclusion—the market should trade higher in the next 6 to 12 months, but at a much reduced rate when compared with the last four months.
If that doesn’t happen, if stocks continue to rip higher at the current rate, we could be set up for a melt-down, which always follows a melt-up. Again, no recession means a bear market is unlikely, but the current environment suggests we may need to deal with increased volatility in 2020.
Best regards,

Daniel A. Ogden
Dock Street Asset Management, Inc. is an investment adviser registered with the U.S. Securities and Exchange Commission. You should not assume that any discussion or information contained in this letter serves as the receipt of, or as a substitute for, personalized investment advice from Dock Street Asset Management, Inc.
It is published solely for informational purposes and is not to be construed as a solicitation nor does it constitute advice, investment or otherwise.
To the extent that a reader has questions regarding the applicability of any specific issue discussed above to their individual situation, they are encouraged to consult with the professional advisor of their choosing.
A copy of our Form ADV Part II regarding our advisory services and fees is available upon request.
Our comments are an expression of opinion. While we believe our statements to be true, they always depend on the reliability of our own credible sources. Past performance is no guarantee of future returns.
")