Cases are down and vaccinations are up
We present the following charts without much comment. Never before have we seen an event where the same facts can be interpreted in so many different ways. So rather than interpret the facts, these charts attempt to show what is happening.
First, here are the latest numbers and trends in the United States.
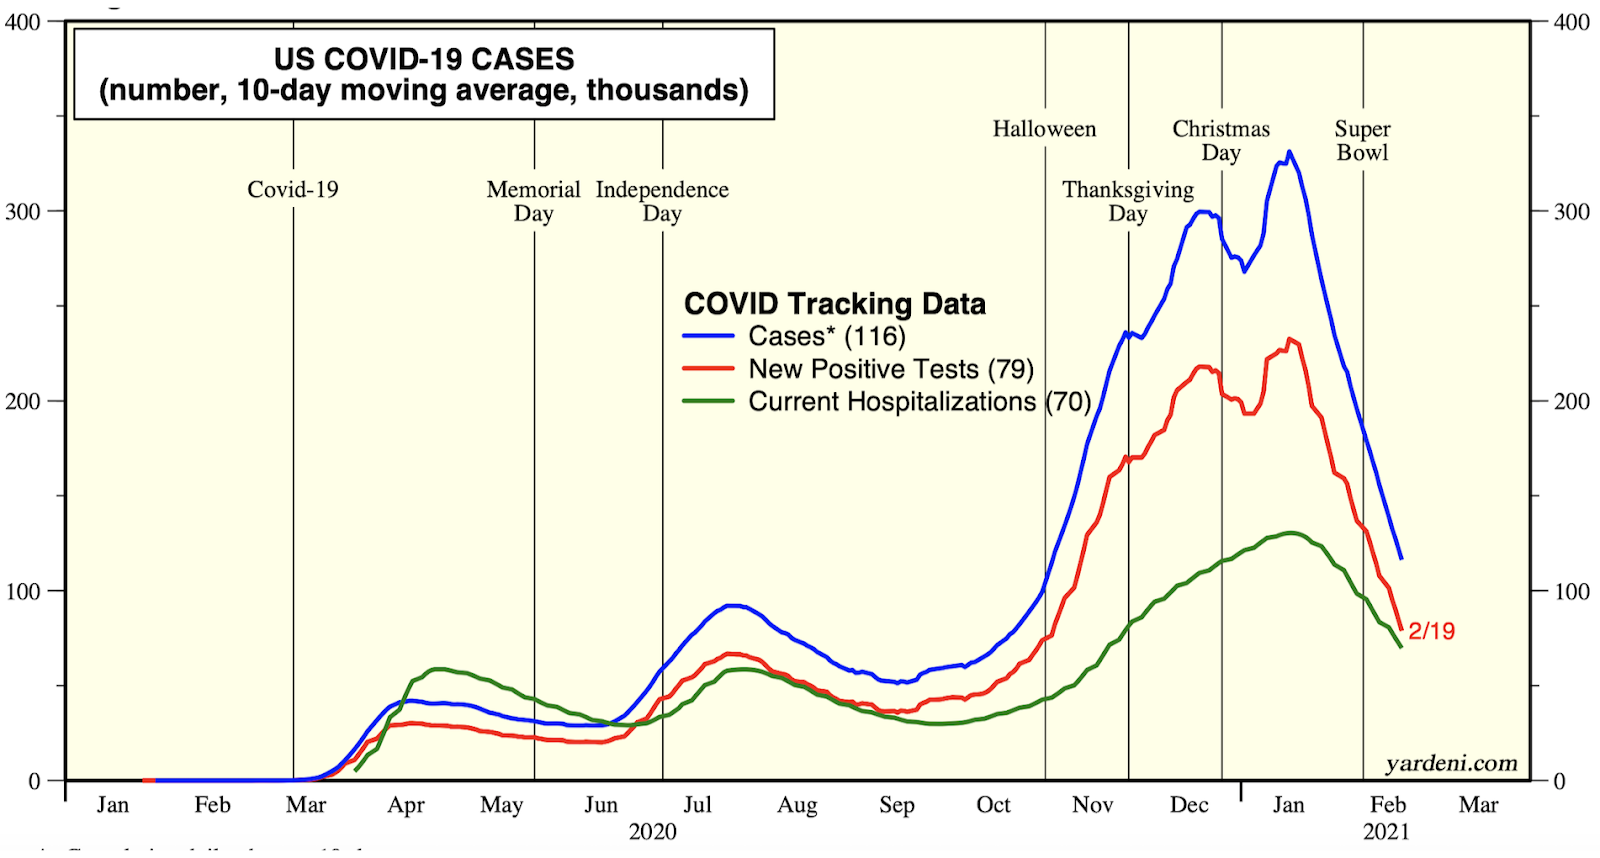
Cases have dropped from over 300,000 to just over 100,000, while hospitalizations are down by about 50% from the January peak. Over 65 million vaccine doses have been administered in the US covering 13% of the population—a good result as the chart below shows.
And below are the world-wide figures for cases and deaths per day.
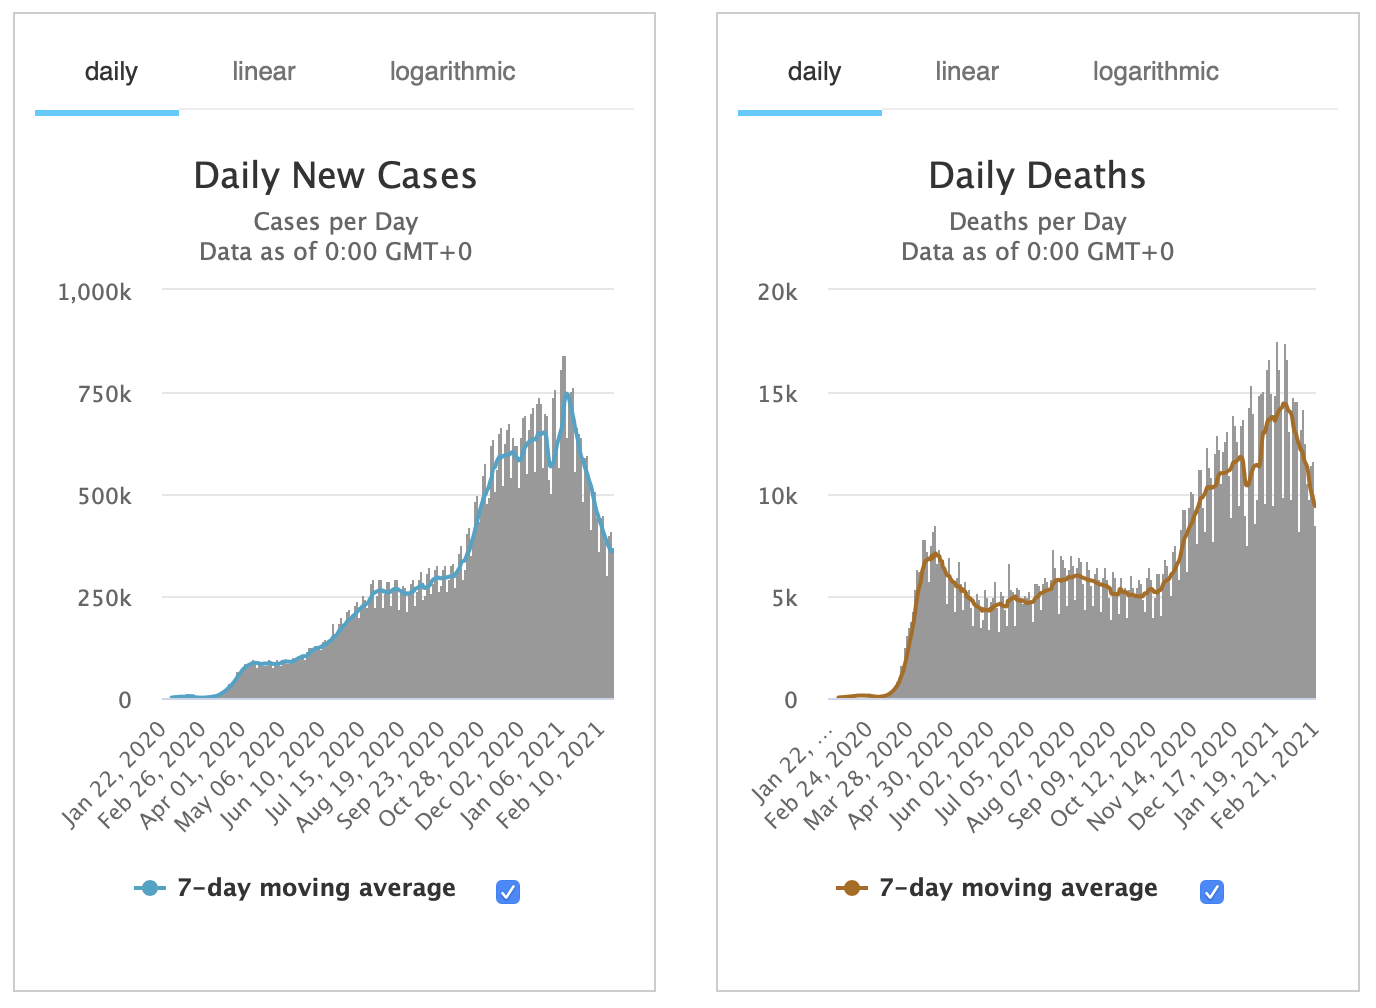
Cases have dropped from over 800,000 per day to about 365,000. Daily deaths are down to 9,500 from a high of 14,000.
So for now all the numbers are moving in the right direction. The optimists see an end to the pandemic, while the pessimists project another peak in the future maybe caused by new strains of the disease reported around the world.
In spite of a wide variety of lockdown policies, both the world peak and the US peak occurred about the same time in early January. If policies were the determining factor, it would be reasonable to expect a bigger difference between regions and countries, but all the peaks in this latest wave matchup in time.
It is interesting that the latest wave turned down well before vaccinations became widespread.
In the meantime world economies are booming or improving as central banks and governments flood the system with cash. That may cause problems down the road, but not in 2021.
Best regards,

Daniel A. Ogden
Dock Street Asset Management, Inc. is an investment adviser registered with the U.S. Securities and Exchange Commission. You should not assume that any discussion or information contained in this letter serves as the receipt of, or as a substitute for, personalized investment advice from Dock Street Asset Management, Inc.
It is published solely for informational purposes and is not to be construed as a solicitation nor does it constitute advice, investment or otherwise.
To the extent that a reader has questions regarding the applicability of any specific issue discussed above to their individual situation, they are encouraged to consult with the professional advisor of their choosing.
A copy of our Form ADV Part II regarding our advisory services and fees is available upon request.
Our comments are an expression of opinion. While we believe our statements to be true, they always depend on the reliability of our own credible sources. Past performance is no guarantee of future returns.
