How to protect our investments from inflation
A couple of weeks ago we discussed the current economy and concluded that we are in the midst of a massive boom in activity. But is the economy running too hot? Is this a real economic expansion or one only fueled by massive cash creation by the Federal government?
Inflation is making headlines, and for good reason. We will go into that issue below, but past periods of inflation probably won’t serve as a good guide for the next ten years.
This is especially true since deflation is also with us. Technology, the primary tool we use, continues to get cheaper over time. And wages are held in check everywhere as the process of Asian and African workers entering the labor market plays out.
Still, there are good reasons to worry about inflation. The charts below outline the problem.
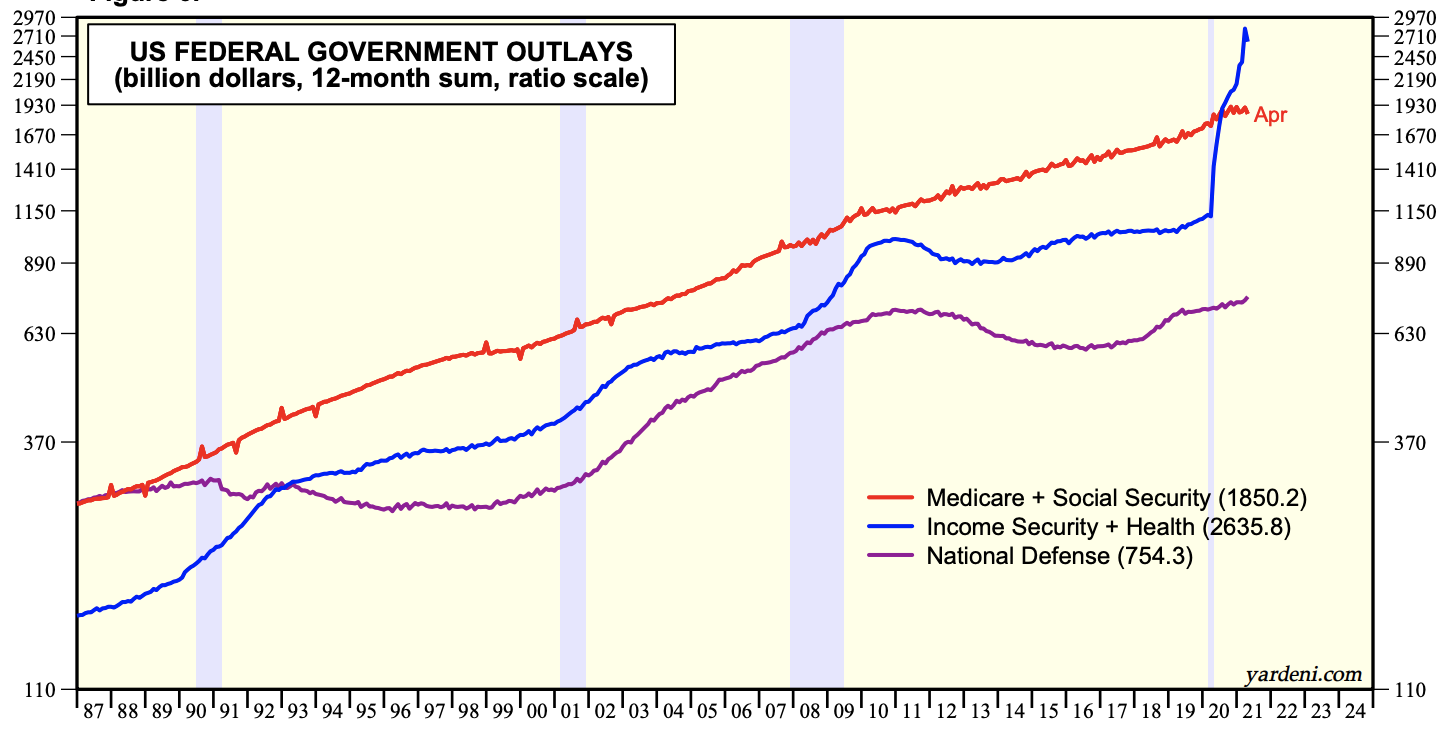
First there’s spending by the Federal government. Spending has increased from just under $5 trillion in 2019 to well over $7 trillion in the last 12 months. And all of the increase is in cash payments to individuals. The following chart shows the change in the three main buckets of Federal spending: Income security/health (blue line), Medicare/Social Security, and Defense.
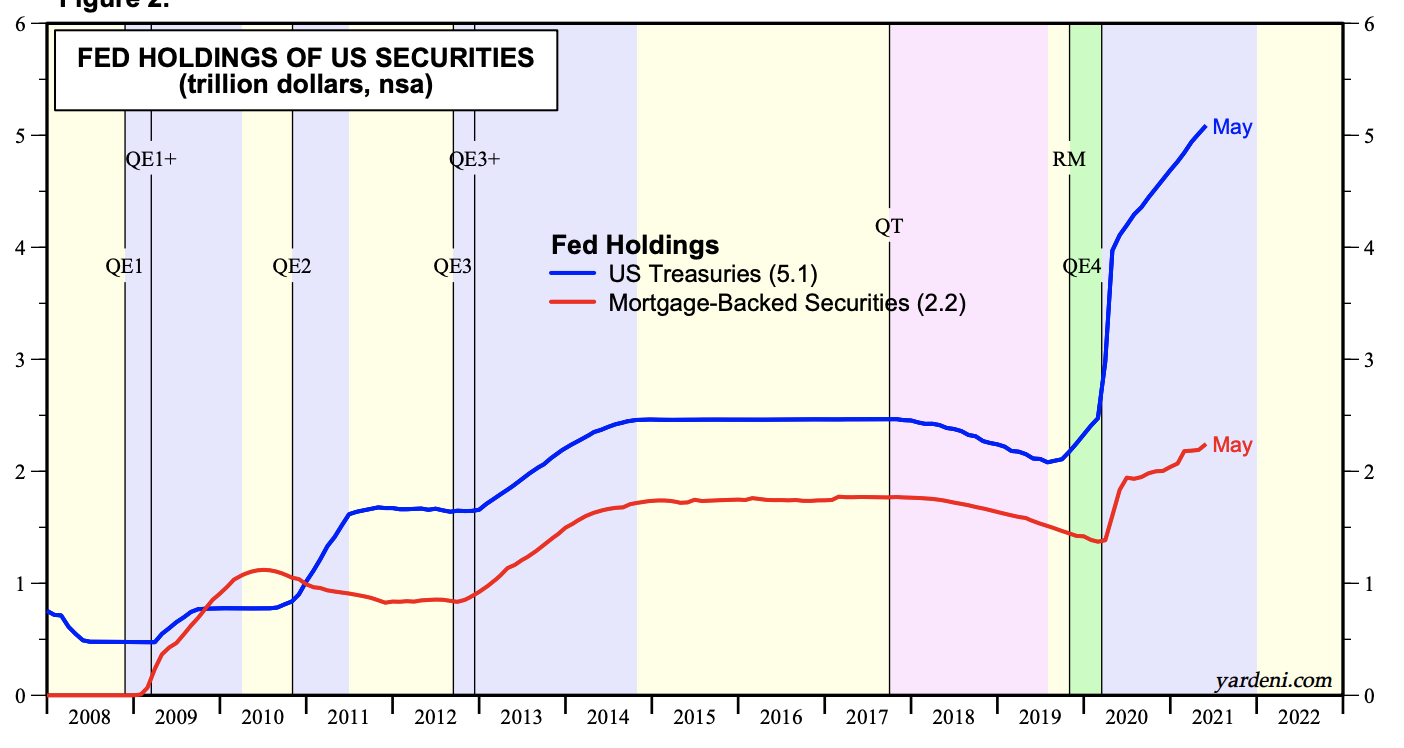
All of this new spending was borrowed, so the Federal deficit in 2020 was $3 trillion. Who is buying that debt? Much of it is being purchased by the Federal Reserve using their power to create new money. This newly created cash is what drives most inflation worries.
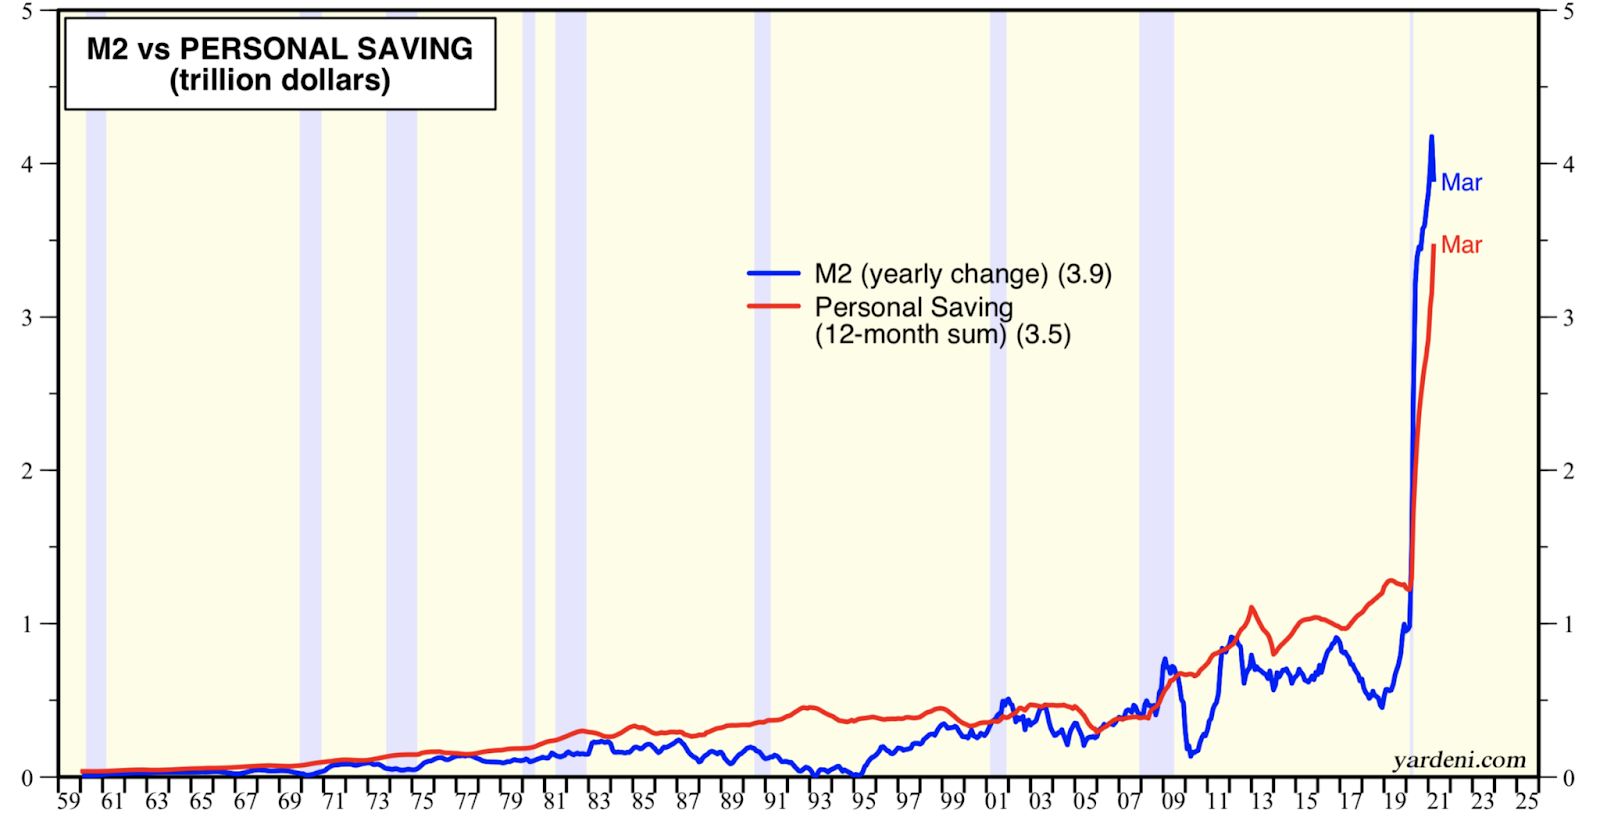
Where’s the money going? The chart below shows that personal savings have increased by $3.5 trillion in the last year. Consumer spending is at record highs, but even American shoppers can’t spend it fast enough to cut into savings. Some of this cash will go into stocks, but much will be spent, driving up prices—think housing.
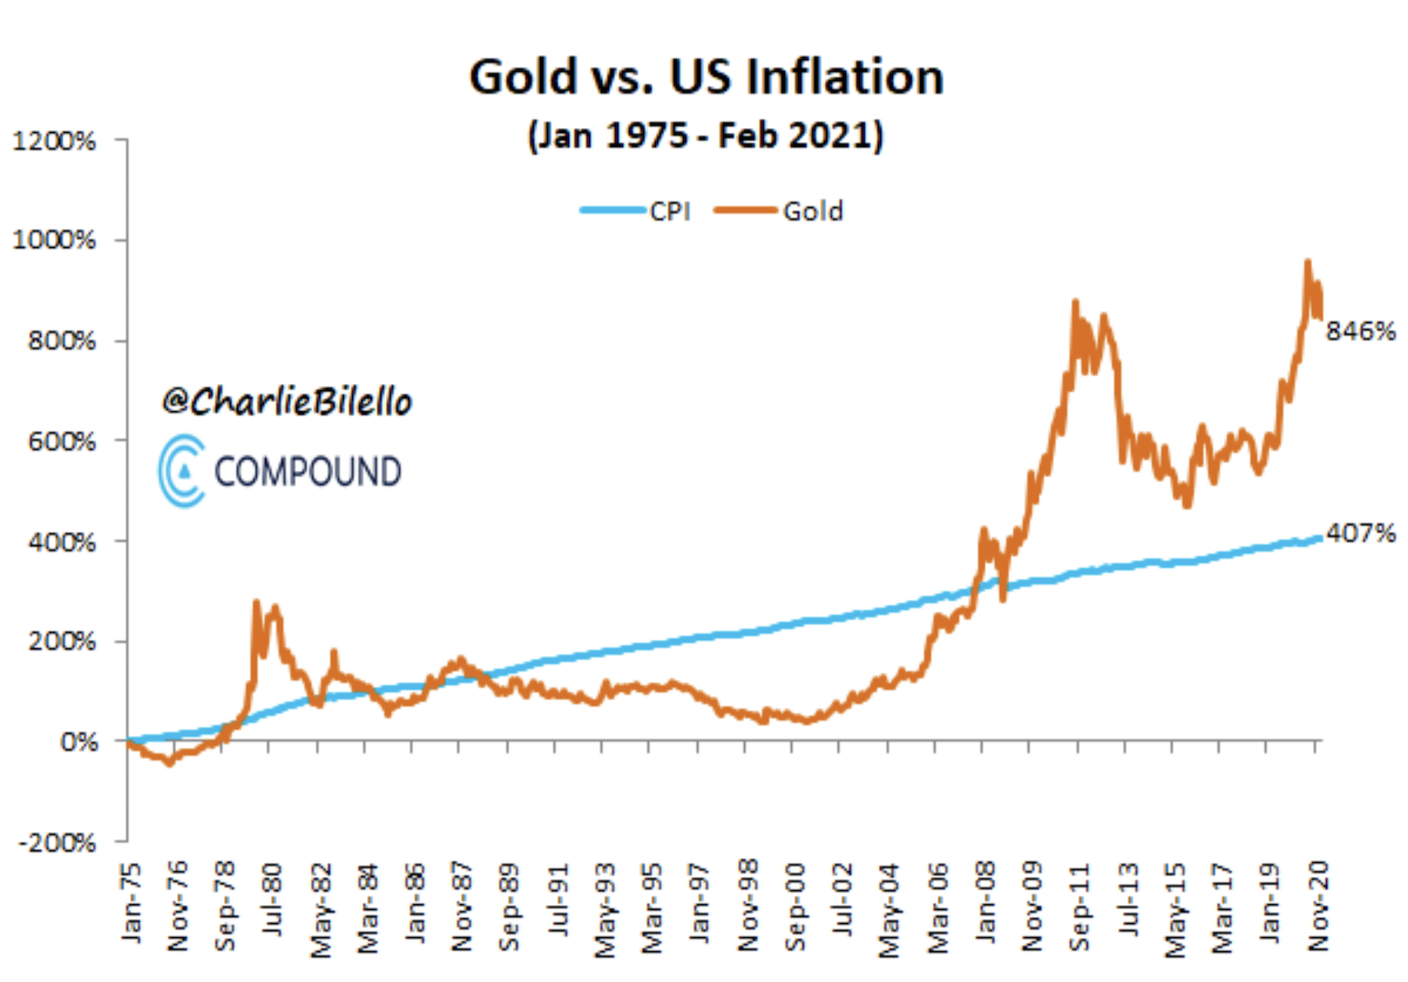
We don’t think this is a replay of the 1970’s, but inflation is upon us and the only question is how long it lasts. So how should investors protect themselves from inflation—first there’s gold. This chart shows gold handily beating the inflation of the last 45 years: 846% to 407%.
But the chart below suggests several better alternatives to gold. This chart covers the same 45 year period but includes bonds, real estate investment trusts, and the S&P 500. Gold and inflation are the squiggly lines near the bottom of the chart.
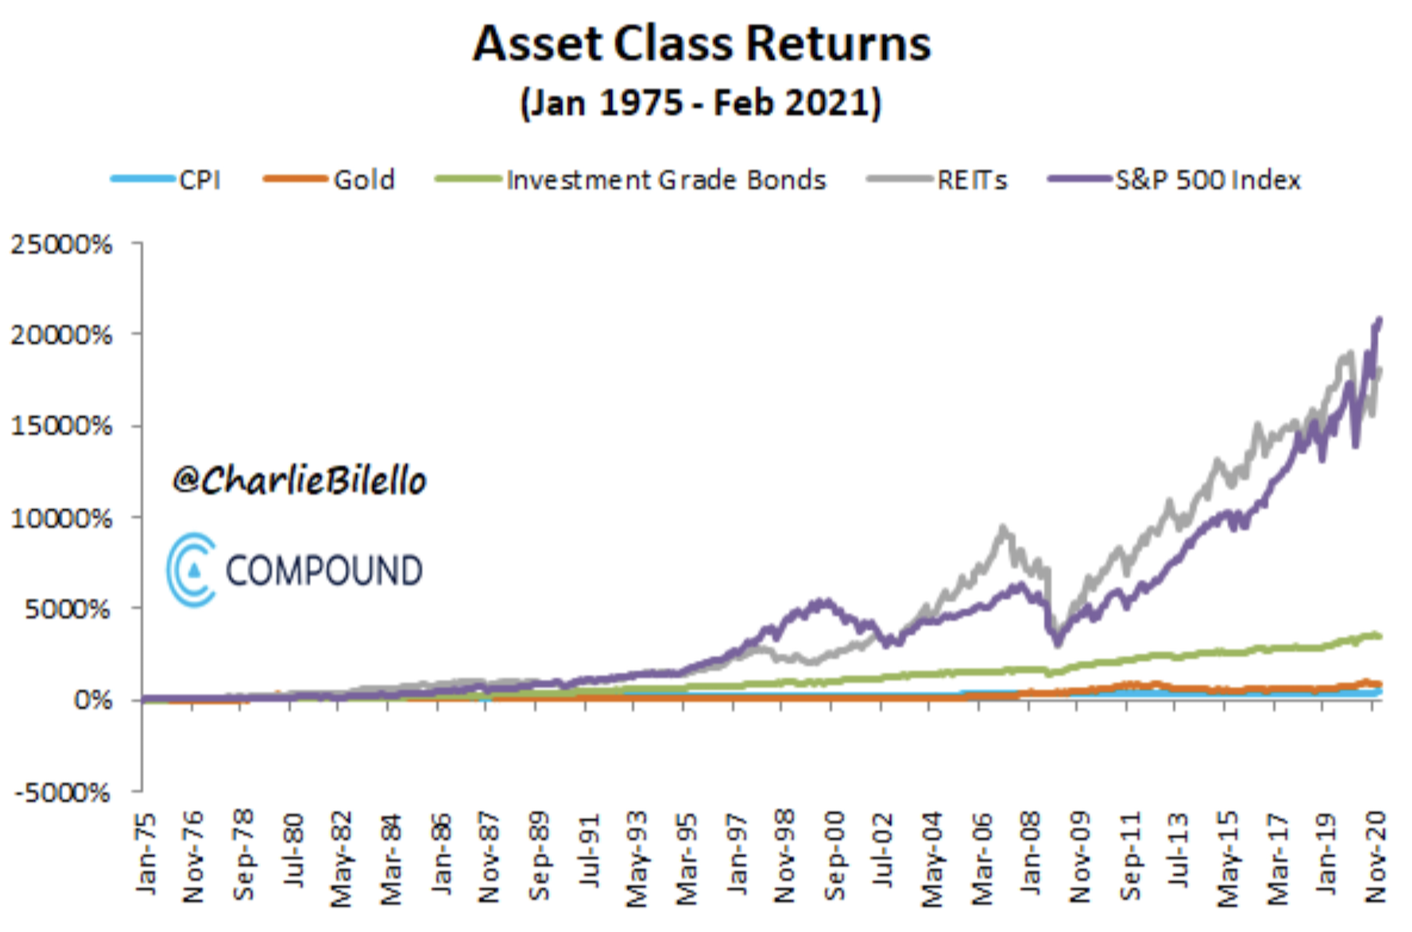
Companies working hard to increase cash earnings turn out to be the best defense against inflation in the long-term.
Still, the next 12 to 24 months could be difficult for stocks if inflation increases and interest rates rise as a result. We’ll keep you posted on how this plays out.
Best regards,

Daniel A. Ogden
Dock Street Asset Management, Inc. is an investment adviser registered with the U.S. Securities and Exchange Commission. You should not assume that any discussion or information contained in this letter serves as the receipt of, or as a substitute for, personalized investment advice from Dock Street Asset Management, Inc.
It is published solely for informational purposes and is not to be construed as a solicitation nor does it constitute advice, investment or otherwise.
To the extent that a reader has questions regarding the applicability of any specific issue discussed above to their individual situation, they are encouraged to consult with the professional advisor of their choosing.
A copy of our Form ADV Part II regarding our advisory services and fees is available upon request.
Our comments are an expression of opinion. While we believe our statements to be true, they always depend on the reliability of our own credible sources. Past performance is no guarantee of future returns.
