So far this is a “normal” year for stocks, even though it doesn’t feel that way
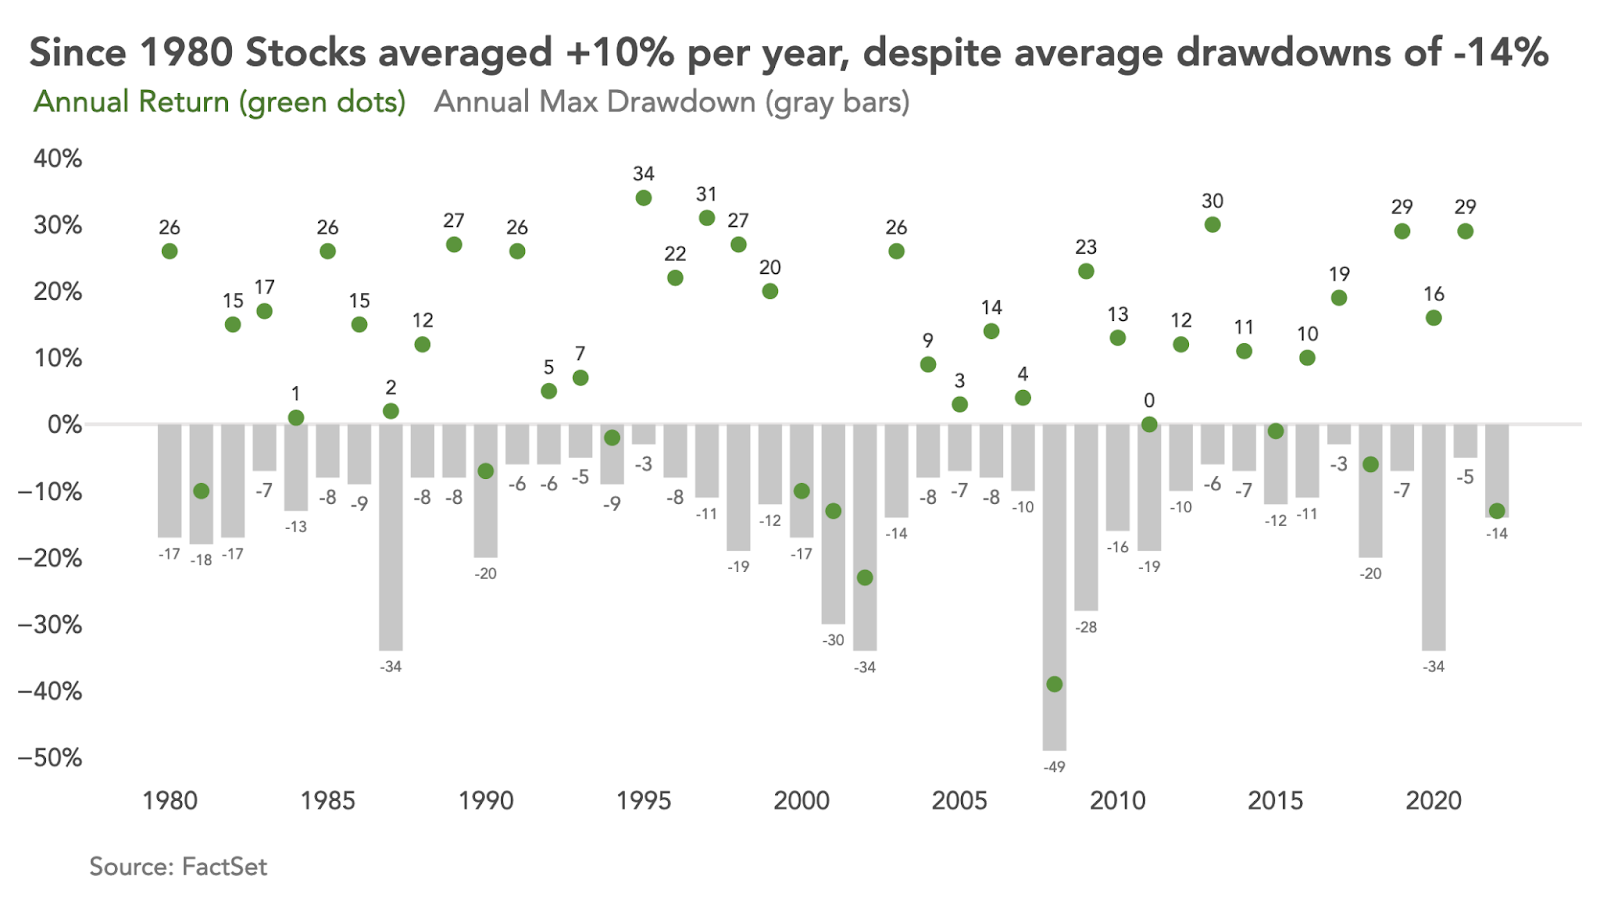
The chart below helps us put this year’s nasty stock market in perspective. The green dots mark the gain or loss for the full year, while the gray bars indicate the largest loss during that year.
The average loss during a year is 14%, (about where we are right now) and those losses (drawdowns) happen every year. Meanwhile, the full year results show 9 negative years out of the last 43.
While the current correction is normal, it never feels normal. Never. And each specific instance contains specific worries that are in full focus at the time. Only in hindsight do these look like easy buying opportunities. But in real time, they don’t look like an opportunity and are anything but easy.
Our repeated warnings in the last couple of years that our returns would inevitably fall below the experience of the 2017-2021 period have finally come to pass. But admittedly in a nastier way than we imagined. But that’s usually the way it works. The pleasant surprises of the last 5 years have given way to the opposite in 2022.
Still, the businesses we own are not failing or even suffering losses—profits continue to grow. That improving earning power will be recognized by investors over time in the form of higher stock prices. We just don’t know when the current environment will improve or precisely when the losses of 2022 will be recovered.
Best regards,

Daniel A. Ogden
Dock Street Asset Management, Inc. is an investment adviser registered with the U.S. Securities and Exchange Commission. You should not assume that any discussion or information contained in this letter serves as the receipt of, or as a substitute for, personalized investment advice from Dock Street Asset Management, Inc.
It is published solely for informational purposes and is not to be construed as a solicitation nor does it constitute advice, investment or otherwise.
To the extent that a reader has questions regarding the applicability of any specific issue discussed above to their individual situation, they are encouraged to consult with the professional advisor of their choosing.
A copy of our Form ADV Part II regarding our advisory services and fees is available upon request.
Our comments are an expression of opinion. While we believe our statements to be true, they always depend on the reliability of our own credible sources. Past performance is no guarantee of future returns.
