Time is on the side of the patient investor
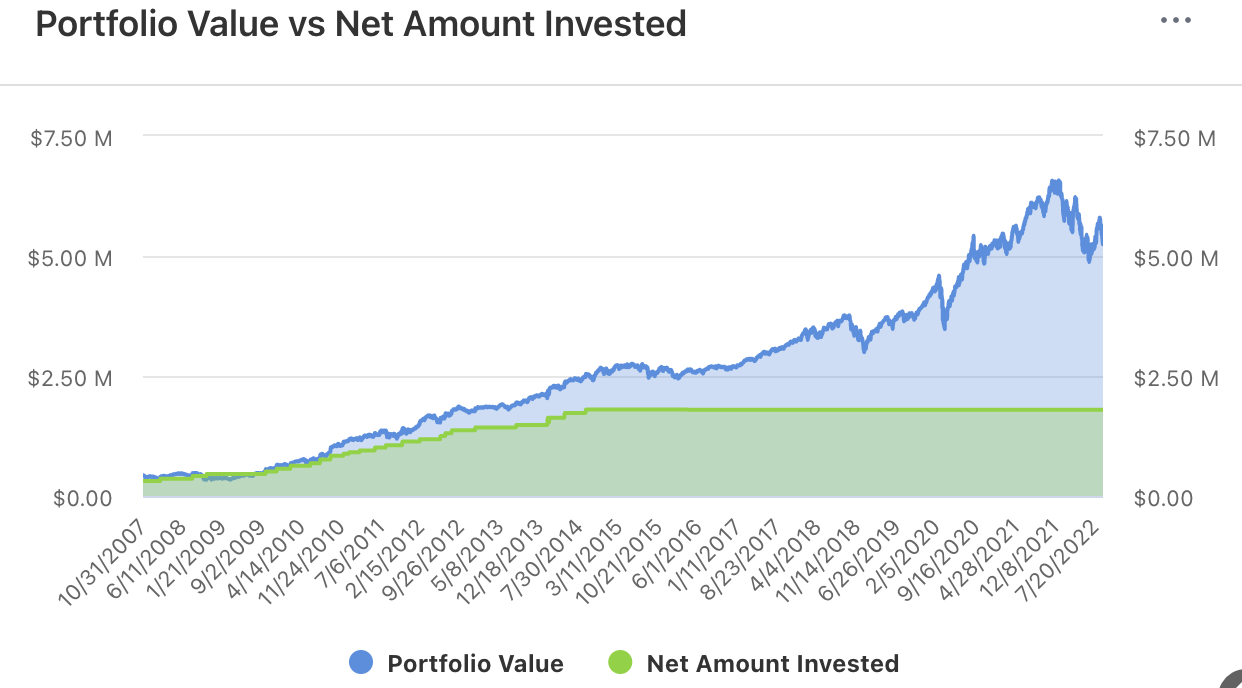
The portfolio management system we began using two years ago yields some interesting information about client accounts. Below are two charts that illustrate why investing for the long-term can be rewarding. More importantly, the charts show that accepting the risks of investing is necessary if clients are to achieve financial security.
The green area on each chart shows the amount of cash added or withdrawn over time, while the blue area adds to that the gains achieved for the period. The area between the lines is the gain from investing.
Both charts cover the last 15 years from the peak before the 2008 Crash through this August. So the results include the bear markets of 2008-09, 2020, and now 2022.
The first example is a client who added $1.3 million in cash over 8 years to an original $400 thousand and has not added or withdrawn any since. The account today is worth more than $5 million. The same amount invested if put under the mattress or in a checking account would be worth only $1.7 million today.
The second example is more interesting, and more typical of our clients. This account started with a fixed amount to invest (about $1.4 million), no withdrawals were made for the first four years, and then the client withdrew cash for the next 12 years at a rate that averaged 4% per year.
This account balance is also in the neighborhood of $5 million today, but the path to that total is very different. In fact the original investment has been spent and if this client had avoided investing by staying in cash for the last 15 years, she would be $500,000 in the hole today. Notice how the green line goes below zero.
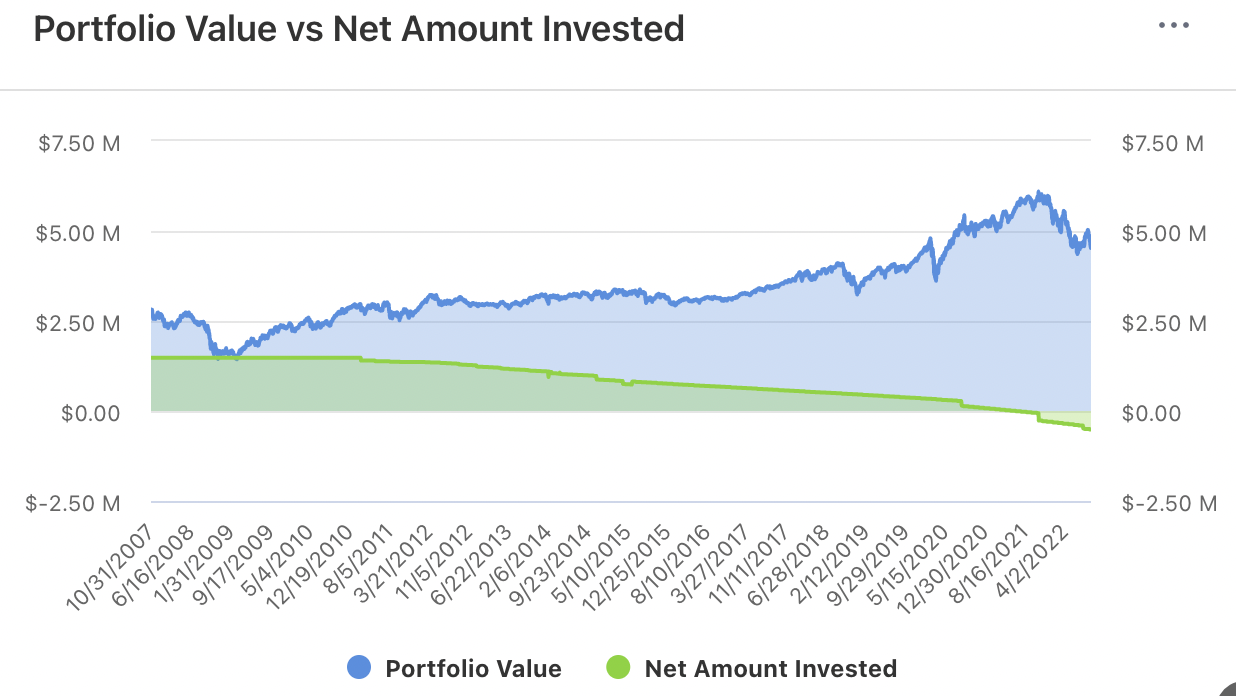
It must be emphasized that this client did not spend irresponsibly, the client stayed within the conservative 4% spending rule. Still, the original nest-egg would be gone by now if not invested. And today the account supports spending at a much higher dollar level because of asset growth.
Of course it was, and still is, a bumpy ride. In the second example all the gains produced before the 2008 bear market were lost that year and the account is far below the peak reached in late 2021.
When we first saw these charts we were shocked at how many client accounts looked like the second example. (Again, we have no spend-thrift clients.) But both examples make the case for investing and allowing those investments to work their magic over time.
Best regards,

Daniel A. Ogden
Dock Street Asset Management, Inc. is an investment adviser registered with the U.S. Securities and Exchange Commission. You should not assume that any discussion or information contained in this letter serves as the receipt of, or as a substitute for, personalized investment advice from Dock Street Asset Management, Inc.
It is published solely for informational purposes and is not to be construed as a solicitation nor does it constitute advice, investment or otherwise.
To the extent that a reader has questions regarding the applicability of any specific issue discussed above to their individual situation, they are encouraged to consult with the professional advisor of their choosing.
A copy of our Form ADV Part II regarding our advisory services and fees is available upon request.
Our comments are an expression of opinion. While we believe our statements to be true, they always depend on the reliability of our own credible sources. Past performance is no guarantee of future returns.
